SAS Studio is a powerful and versatile tool for data analysis and visualization. It offers a comprehensive suite of features for importing, cleaning, transforming, analyzing, and visualizing data. Whether you’re a seasoned data scientist or a beginner, SAS Studio provides a user-friendly interface to unlock insights from your data. This guide dives deep into the functionalities, from basic navigation to advanced programming and collaboration techniques, making SAS Studio accessible to everyone.
This exploration of SAS Studio will walk you through the essential steps to leverage its potential. From importing data and performing statistical analysis to creating insightful visualizations and sharing your findings, this guide provides a practical roadmap for maximizing your use of this powerful tool.
Introduction to SAS Studio

SAS Studio is a user-friendly integrated development environment (IDE) specifically designed for SAS programming and data analysis. It provides a comprehensive platform for writing, executing, and managing SAS code, facilitating various data manipulation, analysis, and visualization tasks. It’s a powerful tool for transforming raw data into actionable insights.
SAS Studio simplifies the complex process of data analysis by offering an intuitive graphical interface. This streamlined approach enables users with varying technical backgrounds to efficiently work with SAS data sets, create reports, and generate visualizations, all within a familiar and accessible environment. It fosters a streamlined workflow for SAS tasks, from data exploration to model building.
Key Functionalities of SAS Studio
SAS Studio offers a suite of functionalities that cater to diverse data analysis needs. These functionalities include an interactive environment for developing and executing SAS code, a robust graphical user interface for data visualization, and comprehensive capabilities for managing SAS projects and data sets. This integration of tools streamlines the entire data analysis lifecycle.
- Code Development and Execution: SAS Studio facilitates writing, editing, and running SAS programs. It provides features such as syntax highlighting, code completion, and debugging tools, which significantly enhance the efficiency of the coding process. This is essential for tasks such as creating data transformations and generating reports.
- Data Visualization: SAS Studio allows users to create a variety of visualizations, including charts, graphs, and other visual representations of data. This visual exploration is crucial for identifying patterns and trends within datasets, often leading to more profound insights. Examples include histograms to visualize data distribution, scatter plots to analyze relationships between variables, and box plots to compare groups.
- Data Management: SAS Studio provides tools for managing and manipulating data sets. Users can import data from various sources, clean and transform data, and create new data sets. This comprehensive data management capability ensures data integrity and enables users to prepare data for analysis.
- Project Management: SAS Studio allows users to organize and manage their SAS projects efficiently. This includes storing code, data, and output in a structured manner, promoting collaboration and reproducibility. This aspect is crucial for maintaining the integrity of analysis and ensuring consistency.
Role in Data Analysis and Visualization
SAS Studio plays a pivotal role in data analysis and visualization by providing a comprehensive environment for executing SAS procedures, generating reports, and creating interactive visualizations. It’s a crucial component in turning raw data into meaningful insights. It empowers data analysts to perform complex calculations, build sophisticated statistical models, and create compelling visual representations of their findings.
Common Use Cases for SAS Studio
SAS Studio is used in a wide array of applications. Its versatility makes it valuable in diverse industries and fields. Its common applications include:
- Market Research: Analyzing customer demographics and preferences to identify trends and develop targeted marketing strategies.
- Financial Modeling: Building models to predict financial performance, assess risk, and optimize investment strategies.
- Healthcare Analysis: Identifying trends in patient data to improve treatment outcomes and enhance healthcare efficiency.
- Retail Analytics: Analyzing sales data to identify best-selling products, understand customer behavior, and optimize inventory management.
SAS Studio Versions and Features
Different versions of SAS Studio cater to varying needs and technical requirements. The specific functionalities and features may vary depending on the version.
| Version | Key Features | Target Users | Typical Applications |
|---|---|---|---|
| SAS Studio (latest version) | Enhanced user interface, improved code editing features, integration with other SAS tools, seamless data management tools. | Data scientists, analysts, and developers | Comprehensive data analysis, reporting, visualization, and advanced modeling |
| SAS Studio (older version) | Basic functionalities of code execution and data visualization. | Students, researchers, and entry-level analysts | Basic data exploration, reporting, and introductory data analysis |
| SAS Studio (cloud-based version) | Accessible from any location with internet connection, collaborative features for teamwork. | Teams, distributed teams, and remote users | Collaborative data analysis, shared project management, and remote access to SAS resources |
| SAS Studio (server-based version) | Secure and controlled environment for data analysis, access control and permissions, and centralized management. | Large organizations, data governance teams | Enterprise-level data analysis, compliance, and governance |
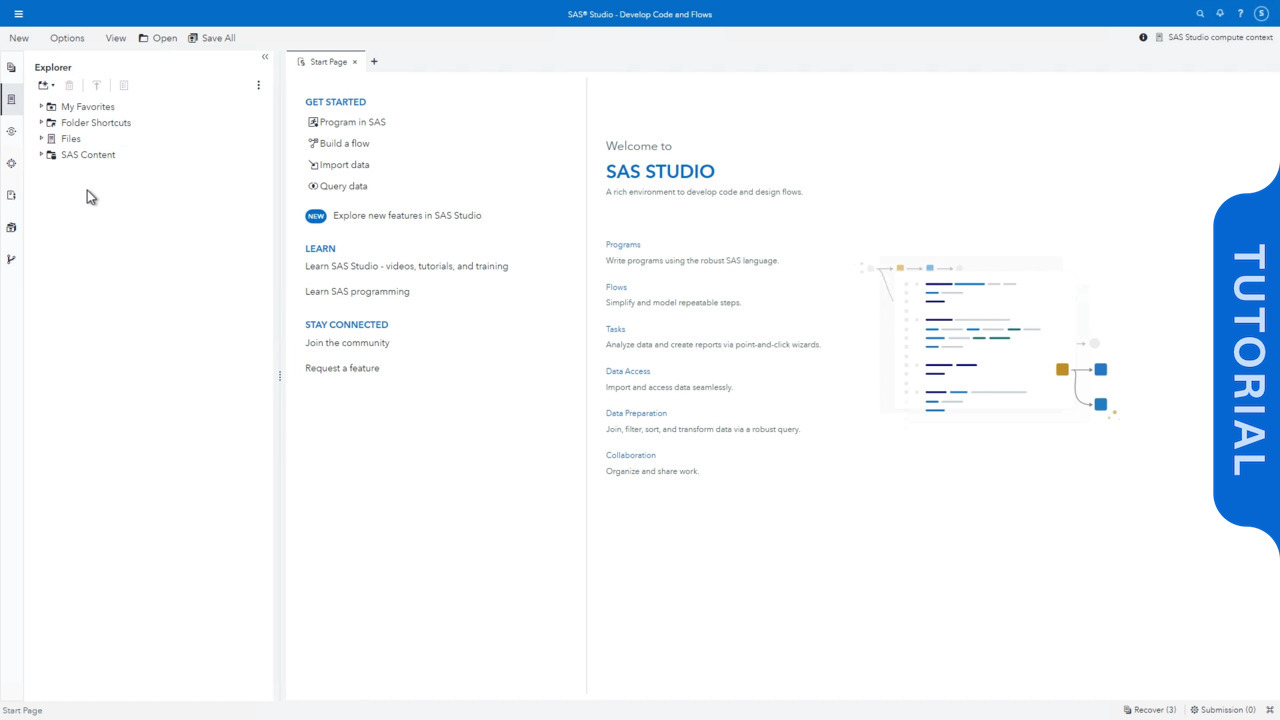
SAS Studio Interface and Navigation
SAS Studio provides a user-friendly environment for interacting with SAS procedures, data sets, and other SAS components. Its intuitive layout and navigation features allow users to efficiently manage projects and execute analyses. This section delves into the core components of the SAS Studio interface, demonstrating navigation techniques, project management, and workspace setup.
Interface Layout and Components
The SAS Studio interface is organized into distinct sections, each serving a specific purpose. The primary areas include the Project Navigator, the Editor Pane, the Output Viewer, and the Results Pane. The Project Navigator displays a hierarchical view of projects and their contents, providing easy access to data sets, programs, and other project elements. The Editor Pane is where users write, edit, and run SAS code. The Output Viewer displays the results of executed code, while the Results Pane shows output tables, graphs, and other analysis results.
Navigating the SAS Studio Environment
Efficient navigation within SAS Studio is crucial for streamlined workflow. Users can navigate between different parts of the interface using the tabs, menus, and shortcuts. The Project Navigator facilitates easy access to files and folders within a project. Clicking on a specific file in the Navigator opens it in the Editor Pane, where users can view, modify, and execute code. The Output Viewer allows users to explore the results of their analysis, providing insights into the data and analysis outcomes.
Creating and Managing Projects
Projects in SAS Studio organize related files and resources. Creating a new project involves selecting the “New Project” option, providing a name and location, and choosing the project type. Managing projects involves adding, removing, and modifying files within the project structure. This organizational structure ensures a well-structured and easily maintainable workspace. Users can organize files into folders, making it simple to locate specific elements. Deleting files is done through the Project Navigator by selecting the file and then using the delete function.
SAS Studio Menu Options
| Menu Option | Function |
|---|---|
| File | Creating, opening, saving, and managing files; printing results; and exiting SAS Studio. |
| Edit | Modifying text, selecting elements, finding and replacing text; cutting, copying, and pasting. |
| View | Customizing the display of windows, and showing/hiding toolbars. |
| Run | Executing SAS code, managing jobs, and controlling the execution process. |
| Tools | Accessing various tools and utilities for debugging, managing settings, and customizing the environment. |
| Window | Managing open windows, arranging them, and closing windows. |
| Help | Accessing SAS Studio help documentation, tutorials, and other resources. |
Setting Up a New Workspace
Setting up a new workspace in SAS Studio involves several steps. First, create a new project. Then, add the necessary data sets and programs to the project. Next, configure the workspace settings to match the specific requirements of the analysis. Finally, execute the SAS code to generate the desired results and outputs. This systematic approach ensures a smooth workflow and a well-organized workspace, allowing for efficient and effective analysis.
Data Management in SAS Studio
SAS Studio provides a robust environment for managing and manipulating data. This encompasses a wide range of tasks, from importing and exporting data to cleaning, transforming, and creating entirely new datasets. Mastering these techniques empowers users to effectively work with data within SAS Studio, extracting meaningful insights and generating reliable reports.
Importing and Exporting Data
Data import in SAS Studio allows users to bring data from various sources into the SAS environment. This is crucial for analysis, as it enables the use of SAS procedures and functions on external data. Common methods include importing data from flat files (like CSV, TXT), databases (e.g., SQL), and other SAS datasets. Specific import options depend on the file format and often involve specifying delimiters, data types, and potential encoding issues. Conversely, exporting data enables users to save their processed results for further use or sharing. Common export formats include CSV, Excel, and other compatible file types. This step is critical for archiving data or distributing findings.
Data Manipulation Techniques
SAS Studio offers a diverse set of tools for manipulating data. These include functions for filtering, sorting, merging, and joining datasets. Filtering allows users to select specific rows based on criteria, while sorting arranges data according to specific variables. Merging combines data from different sources, creating a unified dataset. Joining allows combining data based on common variables. Understanding and applying these techniques ensures that data is organized and structured for effective analysis.
Data Cleaning and Transformation
Data cleaning and transformation are vital steps in the data analysis process. SAS Studio provides tools for handling missing values, correcting errors, and transforming data formats. Handling missing values involves techniques like imputation or removal. Correcting errors includes identifying and fixing inconsistencies. Data transformation includes converting data types, creating new variables based on existing ones, and performing calculations. These steps are crucial for ensuring data quality and accuracy. For instance, converting a date string to a proper date format, or correcting errors in a numerical variable.
Creating New Data Sets
SAS Studio enables users to create new datasets based on existing ones or by combining data from different sources. This involves using SAS procedures like `PROC SQL` or `DATA` steps. `PROC SQL` provides a powerful way to query and manipulate data to create a new dataset from existing data. The `DATA` step allows users to write code to perform transformations and calculations on data to create new datasets. Understanding these techniques is crucial for organizing and structuring data for various analyses. For instance, a new dataset containing only customers who have made a purchase in the last quarter.
Data Formats Supported by SAS Studio
| File Type | Description | Example | Notes |
|---|---|---|---|
| CSV (Comma Separated Values) | Plain text file with values separated by commas. | “Name,Age,City” | Common for importing data from spreadsheets. |
| TXT (Text) | Plain text file with values separated by delimiters. | “Name|Age|City” | Supports various delimiters (e.g., tabs). |
| Excel | Microsoft Excel spreadsheet format. | .xls, .xlsx | Import/export options depend on the version. |
| SAS Dataset | SAS-specific data storage format. | .sas7bdat | Efficient for working with large datasets within SAS. |
Data Analysis and Visualization in SAS Studio
SAS Studio provides a powerful environment for conducting data analysis and creating compelling visualizations. Its integrated tools enable users to transform raw data into actionable insights. This section delves into the core functionalities of data analysis and visualization within SAS Studio, outlining its capabilities and practical applications.
Data analysis in SAS Studio goes beyond simple data manipulation. It empowers users to perform in-depth explorations, uncovering hidden patterns and trends within datasets. Visualizations play a crucial role in this process, converting complex data into easily understandable representations. The platform offers a diverse range of tools and techniques for both analysis and visualization, enabling users to gain a comprehensive understanding of their data.
Data Analysis Tools in SAS Studio
SAS Studio offers a rich suite of tools for data analysis, including procedures for statistical modeling, data summarization, and exploratory data analysis. These tools allow users to perform various tasks such as calculating descriptive statistics, generating hypothesis tests, and building predictive models. The platform is designed to be user-friendly, allowing users with varying levels of experience to conduct meaningful analyses. The SAS programming language, integrated into the Studio, provides a high degree of flexibility and control for advanced data manipulation and analysis.
Techniques for Creating Insightful Visualizations
SAS Studio provides numerous techniques for creating informative visualizations. The platform’s visual tools allow users to customize charts and graphs, selecting appropriate types and adjusting aesthetics for optimal clarity. Effective visualization techniques are essential for communicating findings to stakeholders effectively. Understanding the audience and the nature of the data is critical for creating visualizations that accurately represent the data and its underlying patterns. Users can explore different chart types to best represent the relationships and trends within their data.
Performing Statistical Analysis using SAS Studio
SAS Studio facilitates the performance of various statistical analyses. From simple descriptive statistics to complex statistical modeling, SAS Studio provides the tools needed for accurate and reliable results. Procedures for regression analysis, ANOVA, and hypothesis testing are readily available, allowing users to draw informed conclusions from their data. Users can input data sets and specify the desired statistical tests, allowing for precise analysis tailored to the specific research question. Statistical analyses are crucial for identifying patterns and trends within the data, making data-driven decisions possible. The results of these analyses are presented in a clear and concise format, aiding in effective interpretation.
Types of Charts and Graphs Supported by SAS Studio
SAS Studio supports a wide array of chart and graph types, each designed for visualizing different aspects of data. Bar charts, histograms, scatter plots, line charts, box plots, and pie charts are all readily available. The selection of the appropriate chart type depends on the type of data and the insights users are seeking. The versatility of these tools allows for a comprehensive exploration of data trends, distributions, and relationships. The choice of visualization is critical for conveying information accurately and engagingly.
Comparison of Visualization Tools in SAS Studio
| Visualization Tool | Description | Strengths | Weaknesses |
|---|---|---|---|
| SAS Chart Builder | A visual interface for creating charts and graphs. | Intuitive and user-friendly. Supports a wide variety of chart types. | Limited customization options for advanced users. |
| SAS ODS Graphics | Provides programmatic control for creating custom visualizations. | Highly customizable. Allows for complex visualizations. | Requires knowledge of SAS programming. |
| SAS/GRAPH Procedures | Traditional SAS procedures for creating graphs. | Powerful and flexible. Supports a wide range of graphs. | Steeper learning curve compared to other tools. |
| Interactive Charts | Dynamic visualizations that allow users to explore data. | Allows for interactive exploration and data manipulation. | May not be suitable for all types of analysis. |
Programming in SAS Studio
SAS Studio provides a user-friendly environment for interacting with the powerful SAS programming language. This allows users to write, run, and debug SAS code directly within the interface, making it an essential tool for data manipulation, analysis, and visualization.
SAS programming in Studio relies on a specific syntax and structure. Understanding these elements is key to effectively utilizing the platform for complex data tasks. The flexibility and versatility of SAS procedures make it adaptable to diverse analytical needs.
The SAS Programming Language
SAS is a high-level programming language specifically designed for data management, analysis, and reporting. Its structured approach to data manipulation and analysis makes it ideal for tasks ranging from simple data transformations to complex statistical modeling. The language’s rich set of built-in functions and procedures streamlines the development process.
Syntax and Structure of SAS Programs
SAS programs are composed of statements that instruct the SAS system to perform specific actions. These statements follow a specific syntax, which includes s, variables, and operators. A well-structured SAS program is essential for readability and maintainability, making it easier to understand and modify the code later. A typical SAS program includes DATA steps for data manipulation and PROC steps for analysis. The program is typically divided into sections to perform different operations on the data.
Writing and Executing SAS Programs
Writing a SAS program involves crafting the code that defines the desired operations. The process starts with defining the input data set, specifying the desired transformations, and then running the program to generate the output. Executing a SAS program involves submitting the code to the SAS system for processing. This results in the generation of output, often in the form of tables, charts, or reports. The SAS system will execute the program line by line, following the specific instructions within each statement.
SAS Procedures and Their Applications
SAS offers a wide array of procedures for various data analysis tasks. Each procedure is designed to perform a specific type of operation. For example, PROC MEANS computes summary statistics, while PROC REG performs linear regression analysis. PROC SQL allows users to interact with databases, retrieving and manipulating data stored in various formats. Understanding the capabilities of each procedure allows users to choose the most appropriate tool for a specific analytical need.
| Procedure | Description | Application |
|---|---|---|
| PROC MEANS | Computes summary statistics (mean, median, standard deviation, etc.) | Summarizing data, descriptive analysis |
| PROC FREQ | Performs frequency analysis | Counting occurrences, identifying patterns |
| PROC REG | Performs linear regression analysis | Modeling relationships between variables |
| PROC SQL | Allows interaction with databases | Querying, manipulating data from databases |
Creating a Simple SAS Program for Data Analysis
This example demonstrates a simple SAS program to analyze a dataset containing student scores.
“`SAS
DATA Students;
INPUT StudentID Score;
DATALINES;
1 85
2 92
3 78
4 95
5 88
;
RUN;
PROC MEANS DATA=Students;
VAR Score;
OUTPUT OUT=Summary MEAN=Average;
RUN;
PROC PRINT DATA=Summary;
RUN;
“`
This program first creates a dataset called `Students` with student IDs and scores. Then, `PROC MEANS` calculates the average score and saves it into a new dataset called `Summary`. Finally, `PROC PRINT` displays the average score. This concise example demonstrates the core elements of writing a SAS program. Adapting this structure to more complex analyses is straightforward.
Collaboration and Sharing in SAS Studio
SAS Studio facilitates seamless collaboration and project sharing, enabling teams to work together efficiently on data analysis and reporting tasks. This capability is crucial for organizations seeking to leverage the power of data insights within a collaborative environment. Sharing projects and results is simplified, allowing for the rapid dissemination of findings and promoting knowledge sharing.
Sharing SAS Studio Projects and Results
SAS Studio provides various options for sharing projects and results. These range from simple file sharing to more sophisticated mechanisms for version control and collaborative editing. Efficient sharing mechanisms are essential for effective team collaboration and the successful deployment of data-driven strategies.
- File Sharing: Projects and generated reports can be easily shared as files (e.g., .sas, .pdf, .csv). This straightforward method allows for simple distribution of analysis outputs to colleagues or stakeholders.
- SAS Enterprise Guide: SAS Enterprise Guide allows for seamless transfer of SAS Studio projects and results. This integration provides a convenient way to manage data analysis workflows across different platforms within the SAS ecosystem.
- SAS Cloud Platform: The SAS Cloud Platform offers a centralized repository for SAS Studio projects. This approach enables secure storage and facilitates access control for various team members.
- Collaboration Tools Integration: SAS Studio integrates with various collaboration platforms, including email, document sharing services, and cloud-based file storage. This seamless integration promotes team communication and simplifies knowledge sharing.
Mechanisms for Collaboration on SAS Studio Projects
Collaboration in SAS Studio extends beyond simple sharing. Mechanisms for collaborative editing and real-time feedback are available to facilitate streamlined project development. Such features enhance the efficiency of team projects, leading to more rapid analysis and report generation.
- Version Control: SAS Studio supports version control through Git integration, allowing for tracking changes and resolving conflicts during collaborative development. This ensures a historical record of modifications, crucial for maintaining a consistent and accurate analysis process.
- Shared Workspaces: Some platforms offer shared workspaces, enabling multiple users to work on the same project simultaneously, facilitating real-time collaboration and feedback. This enhances responsiveness and allows for a more dynamic exchange of ideas.
- Commenting and Feedback: Features like inline comments and feedback mechanisms allow users to communicate effectively within the project environment. This direct communication streamlines the review process, reducing ambiguity and facilitating prompt adjustments.
Version Control of SAS Studio Projects
Implementing version control for SAS Studio projects is critical for managing changes, resolving conflicts, and maintaining a historical record of modifications. This systematic approach is vital for collaborative projects and for ensuring data integrity.
- Git Integration: Integrating SAS Studio with Git allows for the use of version control systems. This enables users to track changes to code, data, and reports, facilitating easier rollback to previous versions if needed. This is essential for maintaining project integrity.
- Branching and Merging: The use of branches allows multiple developers to work on different aspects of a project concurrently without interfering with each other. Merging these branches allows for the incorporation of changes, providing a structured and efficient collaborative environment.
- Conflict Resolution: Git handles potential conflicts that may arise during collaborative editing. These conflicts are automatically flagged and resolved through Git’s conflict resolution mechanisms. This facilitates a seamless and smooth workflow for teams.
SAS Studio for Team Collaboration
SAS Studio is well-suited for team collaboration, offering a comprehensive suite of tools for project management, version control, and communication. This facilitates the development of robust data analysis strategies.
- Enhanced Workflow: The collaborative features streamline the workflow, reducing development time and improving overall efficiency. This efficiency is crucial for teams working under deadlines or on large-scale projects.
- Improved Communication: SAS Studio facilitates seamless communication between team members through commenting, feedback, and version control. This clear communication enhances the team’s ability to manage expectations and ensure that everyone is on the same page.
- Data Integrity: Version control ensures data integrity and traceability. This is essential for maintaining a history of changes and avoiding unintended modifications.
Exporting SAS Studio Outputs
The following table Artikels various options for exporting SAS Studio outputs. This flexibility enables users to tailor the presentation of their results to meet specific needs.
| Export Option | File Format | Description | Use Case |
|---|---|---|---|
| Plain Text | .txt | Simple text-based format | Data extraction for basic analysis or import into other systems. |
| Comma Separated Values | .csv | Standard format for spreadsheet software | Data analysis in other applications or creating spreadsheets for presentation. |
| Microsoft Excel | .xls, .xlsx | Widely used spreadsheet format | Visualizing data, creating charts, and sharing with non-technical audiences. |
| Portable Document Format | Creating professional reports and documents for distribution. |
SAS Studio Best Practices and Troubleshooting

SAS Studio, a user-friendly interface for SAS programming, offers a wealth of capabilities. However, maximizing its potential and resolving potential issues require a keen understanding of best practices and troubleshooting techniques. Effective use of SAS Studio streamlines workflows, minimizes errors, and optimizes performance.
Efficient utilization of SAS Studio involves a combination of best practices and proactive problem-solving. This section delves into these critical aspects, providing a comprehensive guide to ensure a smooth and successful SAS Studio experience.
Best Practices for Effective SAS Studio Use
Mastering SAS Studio’s functionalities through consistent best practices significantly enhances user experience and reduces potential errors. These practices include meticulously organizing code, utilizing effective comments, and adhering to standardized coding conventions. Following these best practices helps create maintainable, readable, and reusable code.
- Code Organization: Breaking down complex tasks into smaller, manageable modules enhances code readability and facilitates debugging. This modular approach ensures that each module performs a specific function, making the overall codebase easier to understand and modify.
- Comprehensive Documentation: Adding detailed comments within your SAS code provides context and clarifies the purpose of each step. These comments act as a valuable reference for future modifications or collaboration, facilitating maintenance and understanding.
- Adherence to SAS Coding Standards: Adopting consistent coding conventions enhances readability and maintainability. This practice promotes uniformity across different SAS projects and improves the efficiency of code reviews.
- Regular Backups: Creating regular backups of your work prevents data loss due to unforeseen circumstances. This ensures that you can easily revert to a previous version of your code or data if necessary.
Common Issues and Troubleshooting Steps in SAS Studio
Troubleshooting issues in SAS Studio often involves systematically identifying the source of the problem. Common issues include syntax errors, runtime errors, and connection problems. Effective troubleshooting hinges on careful examination of error messages, code reviews, and a methodical approach to problem-solving.
- Syntax Errors: These errors stem from deviations from SAS syntax rules. SAS Studio provides helpful error messages that pinpoint the location and nature of the syntax error, enabling quick identification and resolution.
- Runtime Errors: These errors arise during the execution of SAS code. Analyzing the SAS log file is crucial for identifying the cause of runtime errors, often indicating issues with data types, missing values, or incorrect calculations.
- Connection Problems: Connectivity issues between SAS Studio and the SAS server can disrupt workflows. Verifying network configurations and server accessibility are essential steps in troubleshooting connection problems.
Common SAS Studio Code Errors and Solutions
Identifying and resolving common errors in SAS Studio code is essential for efficient workflows. This section highlights common errors and their corresponding solutions.
- Missing Semicolons: Forgetting semicolons at the end of SAS statements often results in compilation errors. Carefully review each statement to ensure proper semicolon usage.
- Incorrect Variable Names: Using reserved s or improperly formatted variable names can lead to errors. Adherence to SAS naming conventions is crucial to avoid this type of problem.
- Incorrect Data Types: Applying inappropriate data types to variables can result in runtime errors. Ensure data types match the operations performed to avoid these issues.
Optimizing SAS Studio Performance
Optimizing SAS Studio performance involves minimizing code complexity, utilizing efficient data management techniques, and ensuring adequate system resources.
- Efficient Data Handling: Using appropriate data structures and efficient algorithms reduces processing time, thereby improving overall performance.
- Optimized Code: Writing concise and efficient SAS code reduces the processing time and memory usage, enhancing overall performance.
- System Resource Management: Ensuring sufficient system resources, including memory and processing power, helps prevent performance bottlenecks. This ensures optimal execution of SAS tasks.
Troubleshooting Table
| Error Type | Description | Possible Cause | Solution |
|---|---|---|---|
| Syntax Error | SAS Studio reports a syntax error | Incorrect syntax, missing semicolons, or typos | Review the code for errors, especially missing semicolons, and ensure adherence to SAS syntax rules. |
| Runtime Error | SAS Studio execution fails during runtime | Incorrect data types, missing values, or errors in calculations | Examine the SAS log file, review the data for inconsistencies, and ensure the code is logically sound. |
| Connection Error | SAS Studio cannot connect to the server | Network problems, server downtime, or incorrect server configurations | Verify network connectivity, ensure the server is operational, and confirm the accuracy of server configurations. |
| Performance Issue | Slow processing times | Complex code, inefficient data handling, or insufficient system resources | Simplify the code, utilize optimized data structures and algorithms, and ensure adequate system resources. |
Epilogue
In conclusion, SAS Studio empowers users with a robust platform for data analysis. Its intuitive interface, combined with comprehensive data management and analysis tools, positions it as a valuable asset for diverse projects. From beginners to experts, this guide has provided a comprehensive overview of SAS Studio’s capabilities, showcasing its potential to transform data into actionable insights. Whether you’re tackling complex statistical analysis or simply seeking to visualize trends, SAS Studio offers the tools and support you need.


